
A introduction to the QuarterOne Forecast and how it is derived from your Pipeline and sales velocity.
The Dashboard is the central hub of the QuarterOne app. It provides users with a simple overview of their sales Pipeline, the associated Forecast and sales Velocity Metrics.
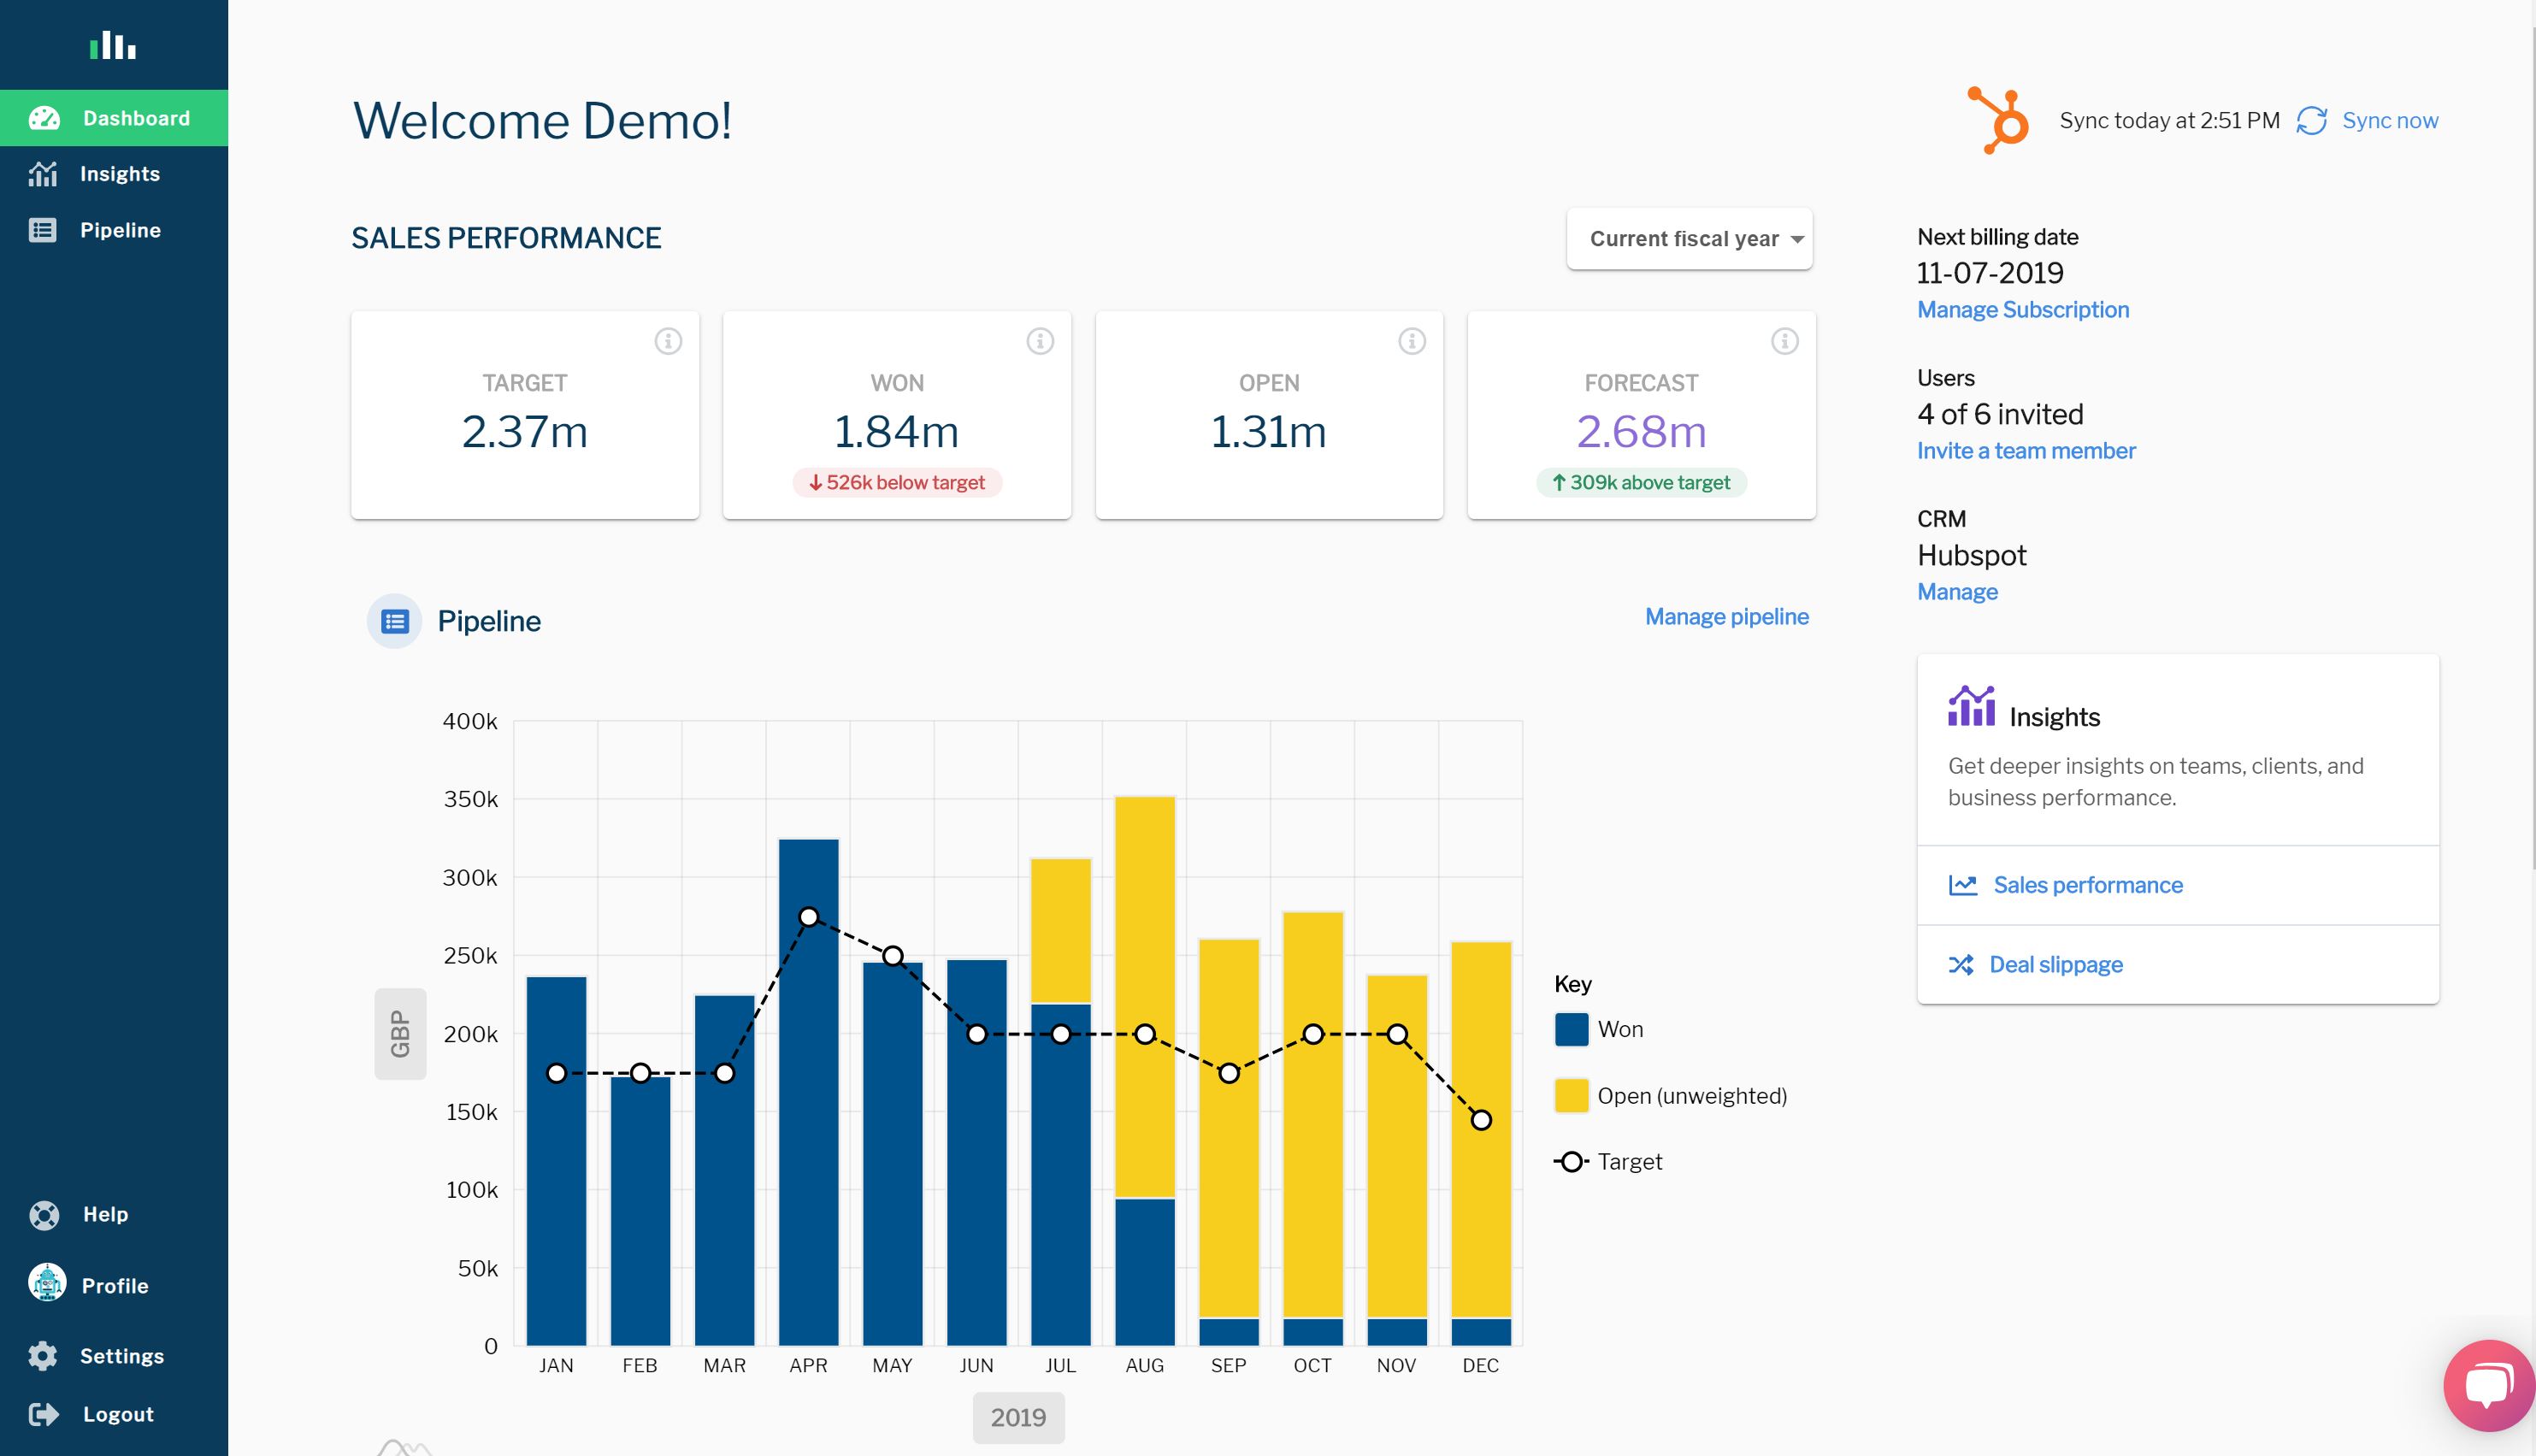
Pipeline
The Pipeline includes both Won and Open deals in a business' sales funnel. The Pipeline figures are at full value - e.g. unweighted. Deals that have been spread over multiple months are automatically reflected on the same basis in the dashboard Pipeline chart.
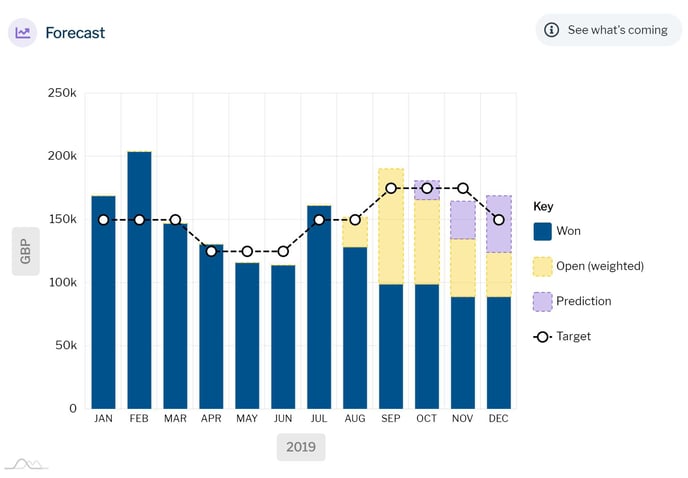
Forecast
The Forecast incorporates the weighted Pipeline with a new business Prediction.
The Open deals in the Pipeline are weighted, using the Forecast Weighting applied to individual deals in the Pipeline module.
The Prediction is calculated using the latest sales Velocity Metrics for the previous 90 days. The calculation is updated automatically on every sync. The metrics applied can also be overriden to correct for any anomalies.
Velocity Metrics
Sales Velocity Metrics are a measure of how quickly your business is winning new deals. A higher sales velocity means you’re bringing in more revenue in less time. The quicker you can grow your pipeline and convert prospects into paying customers, the more successful your business will be.
The five key measures of sales velocity are:
- New deals per month – the average number of new prospects add to your sales funnel each month. This includes all deals in your CRM system, not just the stages included in your QuarterOne sales Pipeline.
- Months to convert – the average number of days it take for prospects to move through your sales stages. The average difference between closed dates and create dates for awaarded deals in your CRM.
- Win rate – the proportion of prospects that convert into paying customers over a given period. Calculated as Won deals/(Won deals + Lost deals). This includes all deals in your CRM system, not just the stages included in your QuarterOne sales Pipeline.
- Average deal value – the average value of awarded deals.
- Average deal length – the average number of months revenue from awarded deals is recognised over.
Please see the article How are the Velocity Metrics used to calculate the Forecast for further information on how to use the Velocity Metrics.